A good impact report doesn’t just summarize your activities. It shows stakeholders, from individual donors to major funders, how your mission is making a difference. It presents your organization as trustworthy, capable, and deserving of support. In this article, we’ll cover the essential parts of a strong impact report: quantitative data, qualitative stories, and visuals. We’ll also offer tips on layout, design, and distribution, and end with a planning checklist to keep you organized.
Why Impact Reports Matter
Many nonprofits underestimate the benefits of a strong impact report. When done well, an impact report can be a powerful communications tool for building relationships, trust, and momentum. It shares the story of how your work changes lives and invites others to be part of that story. Whether you help hundreds or thousands, what matters is showing how you made a difference with clarity, heart, and evidence.
Beyond storytelling, strong reporting builds credibility with funders by showing you track outcomes, not just activities. It helps your staff and board align around clear progress and shared goals. It also supports smarter decision-making by highlighting what’s working. Over time, impact reporting becomes a growth strategy, helping you plan for sustainability and funding readiness, not just reflect on the past.
Before You Begin: A Quick Checklist
- Define your goals. What do you want this report to accomplish?
- Identify your audience. Who are you writing for—donors, board members, partners?
- Assign roles. Who is responsible for collecting data, drafting content, and designing the final layout?
- Take inventory. What data, photos, and stories do you already have on hand?
Define the Problem You’re Solving
Clearly define the problem your mission addresses and support it with credible data. Instead of saying, "There are hungry families in our area," say, "According to KYSTATS, 16% of residents in our county face food insecurity. Our weekend backpack program helps by providing food for 250 elementary school students each week." If hyperlocal data isn't available, thoughtfully use state or county data along with your community's known characteristics. Defining the problem your organization addresses allows you to draw direct lines to how your organization is having a positive impact.
Example
DigDeep starts their impact report off strong by clearly defining the problem they are trying to solve. As you scroll through their digital report you’ll see they have tied each metric to their impact model, which they have also clearly defined:
Measuring What Matters: Quantitative Data
Now that you’ve defined the problem, you’re ready to show you’re solving it. Numbers are the foundation of your impact report, but only if you choose the right ones. Before deciding on what data to collect, take a step back and ask: what story do we want to tell at the end of the year? This guiding question shapes everything, from your daily tracking to how you organize your programs. Instead of waiting until December to gather numbers, focus early on what matters most: What does success look like for your organization, what change are you trying to create, and how will you demonstrate both?
Define what impact means in your context. Is it students improving reading levels? Families staying in stable housing for over six months? Seniors feeling less isolated? These definitions will differ but should align closely with your mission and values. Collect data that supports these definitions, rather than distracts from them.
Example
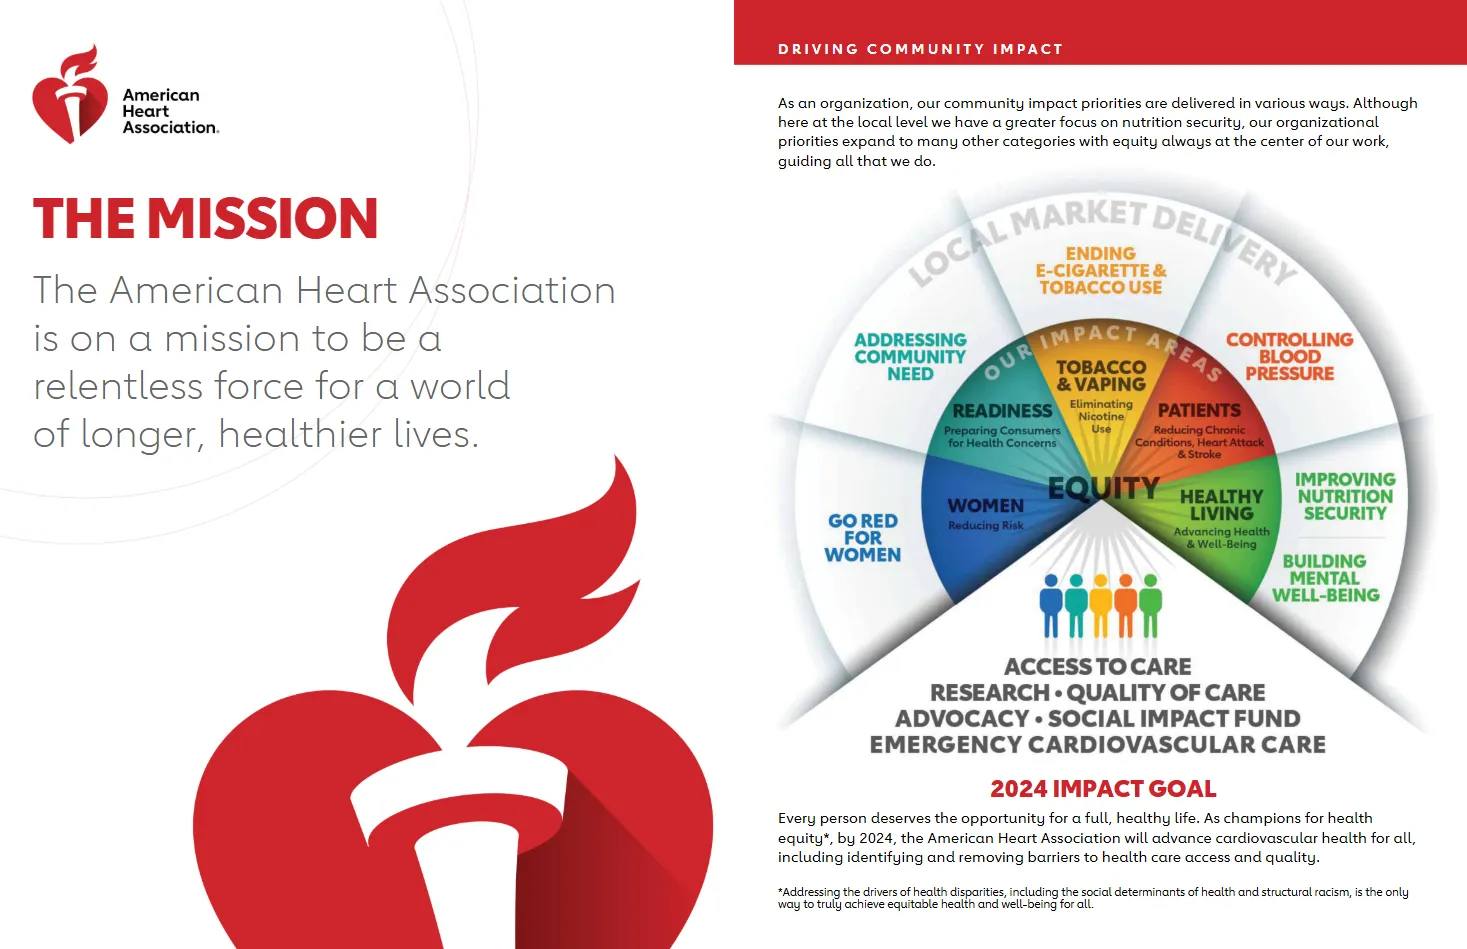
The American Heart Association of Greater Charlotte does an excellent job of tying each of its service areas to a direct impact metric, and then tying all of them to a single, overarching impact goal:
Outputs vs. Outcomes
A common mistake is confusing outputs with impact. Many nonprofits track outputs well, like the number of participants served, events held, meals distributed, or classes offered. But impact reporting requires showing how your work led to change. It’s the difference between outputs and outcomes.
For example, instead of saying, "300 people attended our job-readiness workshop," you could say, "82% of participants felt more confident in job interviews." Instead of "We provided 12,000 meals," say that "93% of recipients experienced less food insecurity within 30 days." Instead of "400 youth completed our after-school program," state that "Students' reading scores increased by an average of 2 grade levels."
Example
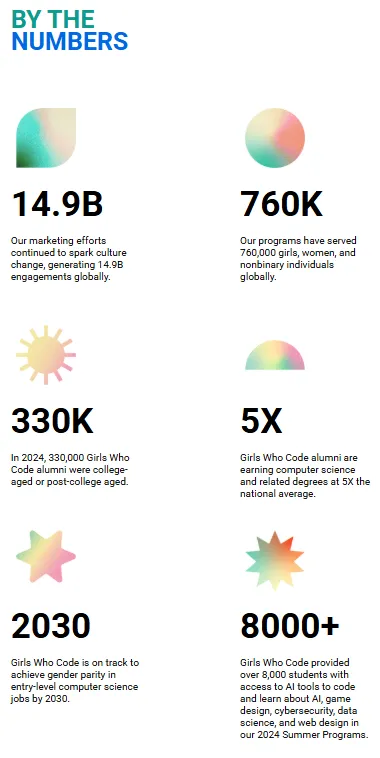
Girls Who Code’s 2024 report does a good job of this in their 2024 impact report. Notice how, instead of merely saying “Our marketing efforts resulted in 14.9B engagements globally”, they frame this stat in terms of impact by tying it to “culture change.”
Measurement Tools
To measure outcomes, you have to prepare in advance and build impact measurement into your daily operations. Decide now, based on the story you want to tell about your organization, what data points you need to track to show measurable impact. You may not have all of your data for this year’s report, but it’s never too late to begin tracking for next year!
The kind of measurement tools you’ll need will vary as much as the data you need to track. Consider whether you’ll need pre- and post-program surveys assessing changes in knowledge, behavior, or confidence; follow-up evaluations done 30 to 90 days later to see if the effects lasted; demographic data showing who you serve; and key performance indicators (KPIs) like cost per participant, program completion rate, donor retention rate, or volunteer hours.
For instance, "We held 15 financial literacy workshops for 250 adults. By the end of the series, 91% of participants felt more confident in managing their money. Three months later, 63% reported creating and sticking to a monthly budget."
Embedding Measurement Into Everyday Work
One major obstacle to effective data collection is that it often feels like an add-on. But by making evaluation part of your daily work, it becomes more manageable and beneficial.
Here’s how to do it:
- Incorporate short surveys into the program experience rather than as follow-ups. For example, hand out a simple three-question form at the end of a workshop.
- Train staff to log participation and key observations right after each session using a shared spreadsheet or Customer Relationship Management (CRM) system with dropdown fields for consistency.
- Create automated feedback forms that go out via text or email after services. Tools like Jotform or Google Forms can help.
- Use built-in scheduling or intake platforms (like Calendly or case management software) to track attendance trends.
For instance, a youth mentoring program could send a monthly check-in survey to mentors, asking how often they met with their mentee and what topics were discussed. Over time, this builds a data bank on consistency, engagement, and outcomes.
Another example: a housing nonprofit might ask each household to complete a quick self-assessment of housing stability at intake, 30 days, and 90 days. This provides a picture of sustained outcomes, not just services provided.
Whatever methods or tools you choose to gather data, it's crucial to designate a staff member to take charge of its management. When you normalize evaluation as part of your organizational culture, you shift from guessing at impact to demonstrating it confidently.
Example
A New Way of Life Reentry Project practices meticulous program evaluation and has the data to show for it. By tracking a variety of metrics throughout the year, they can provide concrete data to show their programs are working. Even without strong graphics or visual hierarchy, the pure numbers make for a powerful impact report.
Highlighting What Makes Your Program Unique
As you develop your evaluation plan, also consider what makes your programs special. Do you provide wraparound services, trauma-informed care, or culturally specific programming? Are you the only provider of a certain service in your area? Do you serve a hard-to-reach or underserved population?
Ensure your data collection captures these unique aspects. For example, if your program has a high retention rate in a community where trust in service providers is low, celebrate that. If your workforce training includes job placement and mental health support, highlight how this integrated model affects long-term job outcomes.
Don't just report what you do—clarify why your approach matters.
Stories That Stick: Qualitative Data
While numbers show that you're making a difference, stories make that difference meaningful. They help people connect emotionally with your work and remember why it matters. Donors, volunteers, and even your team need stories to stay inspired.
Stories help people connect emotionally with your work and remember why it matters.
An impact report should share stories that highlight the human side of your organization's work. Specific examples might include:
1. Testimonials from beneficiaries explaining how your programs changed their lives, such as a student describing how tutoring boosted their confidence and academic performance.
2. Case studies that present the full story of an individual or family, detailing their struggles and how your organization helped them succeed.
3. Personal accounts from staff or volunteers about their experiences with clients, showcasing significant moments of impact or transformation resulting from your organization's efforts.
The most impactful stories showcase transformation. For example, a client named Maria may have lost her job during the pandemic and struggled to feed her children. After receiving emergency assistance from your nonprofit, she found stable housing, secured a job, and now volunteers at your pantry. Her story personifies your mission and shows change over time.
From Testimonial to Narrative: An Example
Testimonial: "This program helped me find a job."
Narrative: After losing her job during the pandemic, Maria struggled to feed her children. She found support through our emergency food program and job-readiness training. Within three months, she secured stable employment and now volunteers at the same pantry that once helped her.
Don’t Forget Staff and Volunteers
Stories can also come from staff or volunteers. One team member might share how a client beamed when they picked out fresh produce for the first time in months—a small moment that speaks volumes about dignity and respect in service delivery.
Make Stories Part of Your Work Flow
To consistently gather stories, integrate story collection into your workflow. After programs, send participants a brief form asking about their experience and if they’re willing to share it. During staff meetings, encourage team members to bring one story from the month. When you identify a compelling story, follow up. Conduct an interview, obtain written consent, and, if possible, pair it with a photo or video.
Example
The People Concern’s impact report uses personal stories to underscore its impact in the community.

Bring It to Life: Photos and Visuals
Photos help illustrate your impact. They break up long blocks of text, make your report more engaging, and reinforce the human aspect of your data. Strong visuals quickly clarify complex work, especially when paired with captions or brief narratives.
Ideally, you should take pictures throughout the year. Have someone on your team capture a few snapshots at every event or program day. These don’t need to be professionally taken. A smartphone with decent lighting and basic framing can work well. If you can, partner with a student photographer or a hobbyist looking to build their portfolio.
Focus on medium or close-up shots of people's faces. Action photos—like kids reading, volunteers packing boxes, or clients selecting fresh food—tend to engage viewers more than posed or distant images. Always obtain written permission before using photos, and organize them in a digital folder by program or event for easy access.
If your programs lack opportunities for photography—like policy work or administrative services—consider using charts, infographics, or illustrated icons to convey your outcomes.
Presenting Your Impact: Layout and Distribution
You have your content. Now it’s time to create a design that people will actually read. Your layout should show hierarchy: the most important stats and quotes should stand out visually, either through larger fonts, bolding, or color highlights. Break up the text with callout boxes, images, and white space to keep the reader from feeling overwhelmed.
You don’t need to be a graphic designer to create a professional-looking report. Free tools like Canva for Nonprofits provide templates for annual or impact reports. You can also check marketplaces like Etsy for customizable nonprofit report templates. For web-based reports, Storyraise is beginner-friendly and made specifically for Nonprofits.
If your budget allows, do consider hiring a freelance designer. It will save you many work hours and ensure you have a professional-looking final product. You’ll save money by providing the designer with everything upfront: written content, photo selections, and layout ideas.
Think carefully about how you’ll distribute your report. If many supporters are older, consider printing physical copies for mailing or handouts at events. For sharing digitally, upload the PDF to your website and email supporters a link. Better yet, create a mobile-friendly version for easy reading on phone screens. These online reports can include hyperlinks, videos, or embedded stories for an interactive experience.
You can also share highlights from your report throughout the year on social media. A powerful quote, compelling statistic, or great photo from the report can each become a post, helping you extend its reach and relevance beyond the initial release.
Behind Schedule? Work With What You Have
If you’re nearing year-end and haven’t collected data or stories throughout the year, you can still create a credible impact report. Start with what you have: program attendance numbers, basic financials, testimonials from thank-you emails or social media comments, and staff reflections. Then present that information as impact. Instead of just stating, "400 people attended our ESL program," say, "400 community members gained English language skills through our ESL program, increasing their ability to communicate confidently at work, in school, and in daily life."
It's always better to be honest and thoughtful with what you have than to make inflated claims. Use this as a chance to improve your data collection systems for next year.
Start Right Now
Use our Impact Reporting Readiness Checklist and pick a program to begin tracking this month.
GET THE IMPACT REPORTING READINESS CHECKLIST HERE
More Tools
- KYSTATS: Statewide data on education, workforce, and economic trends (For an in-depth look at how to use KYSTATs, watch our webinar recording here)
- Canva for Nonprofits: Free templates and design tools for nonprofit communications
- Taproot Plus: Connects nonprofits with pro bono support including design, marketing, and data help
- VolunteerMatch: Helps find local volunteers with professional skills
- Storyraise: An easy drag and drop tool for creating web-based impact reports and more
- Venngage for nonprofits: nonprofits can get 30% off this tool for creating infographics and other data visualization graphics