The Center on Rural Innovation (CORI) is a national nonprofit that helps rural communities build stronger local economies by using technology in practical ways. CORI works directly with rural communities to expand entrepreneurship, increase access to tech jobs, and build local capacity for long-term economic success.
CORI provides easy-to-use data, hands-on support, and strong partnerships with communities. The focus is on turning information into action, helping local leaders understand their community’s needs, plan impactful projects, secure funding, and make smart decisions about where to invest.
CORI’s Rural Economic Development Tool
CORI’s Rural Economic Development Tool is a web-based dashboard designed specifically for rural communities. It brings together 25 indicators related to economic growth and opportunity into a single, easy-to-use platform. The tool is built for practitioners, including grant seekers, who need reliable data but who may not be experienced data analysts.
The tool draws from well-known federal data sources, including the American Community Survey, Bureau of Economic Analysis, Census Business Dynamics Statistics, Business Formation Statistics, Building Permits Survey, Federal Communications Commission broadband data, and Securities and Exchange Commission Form D filings. These sources are widely recognized by funders, making the data credible and appropriate for grant applications.
Rather than searching for information from multiple federal sources, users of the CORI tool can explore trends, benchmarks, and visuals in one place. For grant writers, the tool is especially beneficial in developing needs statements, benchmarking against peer communities, and strengthening grant narratives.
Example of Peer Comparison
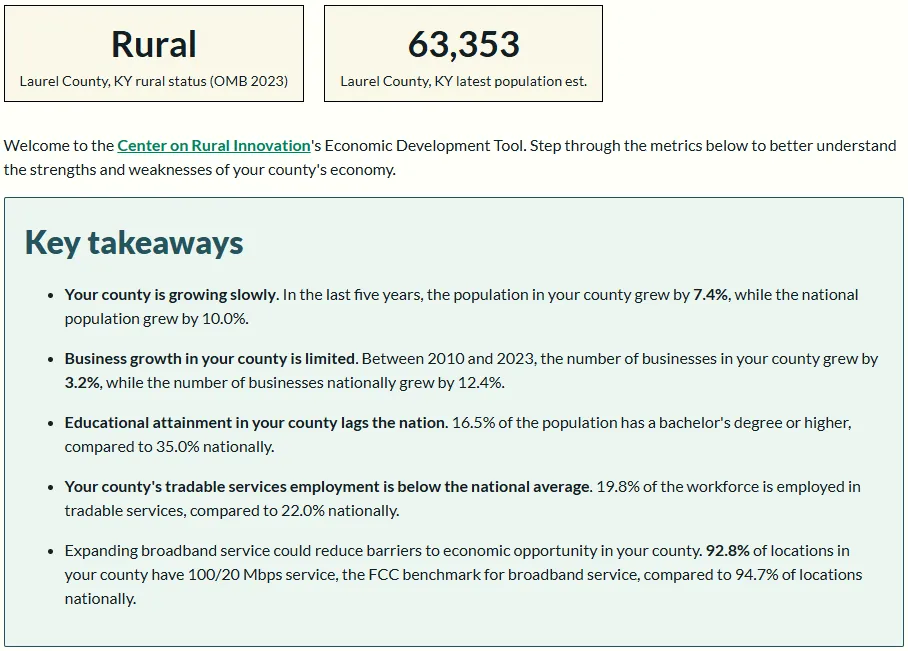
This example image shows how the CORI tool can be used to compare two rural Kentucky counties. Laurel County is benchmarked against Barren County to highlight differences in population growth, business growth, educational attainment, workforce composition, and broadband access. The key takeaways summarize where Laurel County is keeping pace with peers and where gaps exist, such as slower business growth and lower educational attainment. For grant writers, this type of comparison helps explain local challenges in context and strengthens the case for targeted investment.
What the Tool Measures
Workforce: Workforce indicators focus on employment, wages, education, and occupational trends. These measures describe labor market strength, income potential, and workforce readiness. Grant applicants can use employment trends to highlight barriers to workforce participation or gaps in economic recovery. Wage data can support the case for training and career pathways that lead to incomes sufficient to support families. Education and occupational trends can also demonstrate that proposed programs are aligned with current and future job demand.
Entrepreneurship: Entrepreneurship indicators track business growth, private investment, self-employment, industry mix, and remote work. Together, these measures show how businesses start and grow, how entrepreneurs access capital, and how local economies are adjusting to changing work patterns. Grant applicants can use this data to support the need for small business assistance, access-to-capital programs, industry-focused strategies, coworking spaces, and efforts to attract and retain talent.
Infrastructure: Infrastructure indicators look at whether high-speed internet is available, whether people are actually using it, and whether households have access to computers. Together, these measures show that having internet service in a community is only part of the picture; people also need to be able to afford it and use it at home. Information about where broadband is available can help support requests to expand internet service. Data on internet use and computer access can show the need for programs that lower costs, build basic digital skills, or provide devices to people who need them.
Demographics: Demographic indicators include population change, age distribution, race and ethnicity, and income distribution. These measures help clearly describe who lives in a community and who benefits from proposed projects. Grant applicants can use demographic data to document community need, identify populations most affected by the problem, and justify where additional services or supports will have the greatest impact.
Quality of Life: Quality-of-life indicators look at housing supply, housing costs, and the share of renters and homeowners facing high housing expenses. These measures highlight the connection between housing affordability, stability, and economic growth. Grant applicants can use these indicators to explain challenges related to workforce recruitment, housing instability, and the need for strategies that preserve affordable housing.
To explore CORI’s Rural Economic Development Tool, click here.