Trusted, Kentucky-Specific Data
When you're writing a grant proposal to address housing needs in your community, whether for rental assistance, homeownership programs, or housing development, data is power. The Kentucky Housing Corporation (KHC) offers one of the most comprehensive, Kentucky-specific housing data tools available through its Housing Supply Gap Analysis.
This statewide report and online dashboard can help you support your case with current, county-specific, income-specific housing data across the Commonwealth.
What Is the Housing Gap? (And Why It Matters in a Grant Proposal)
In simple terms, a housing gap is the difference between how many homes are needed and how many are available at prices people can afford. When there aren’t enough homes, especially affordable ones, people are rent-burdened, priced out of ownership, or even pushed into unstable housing situations.
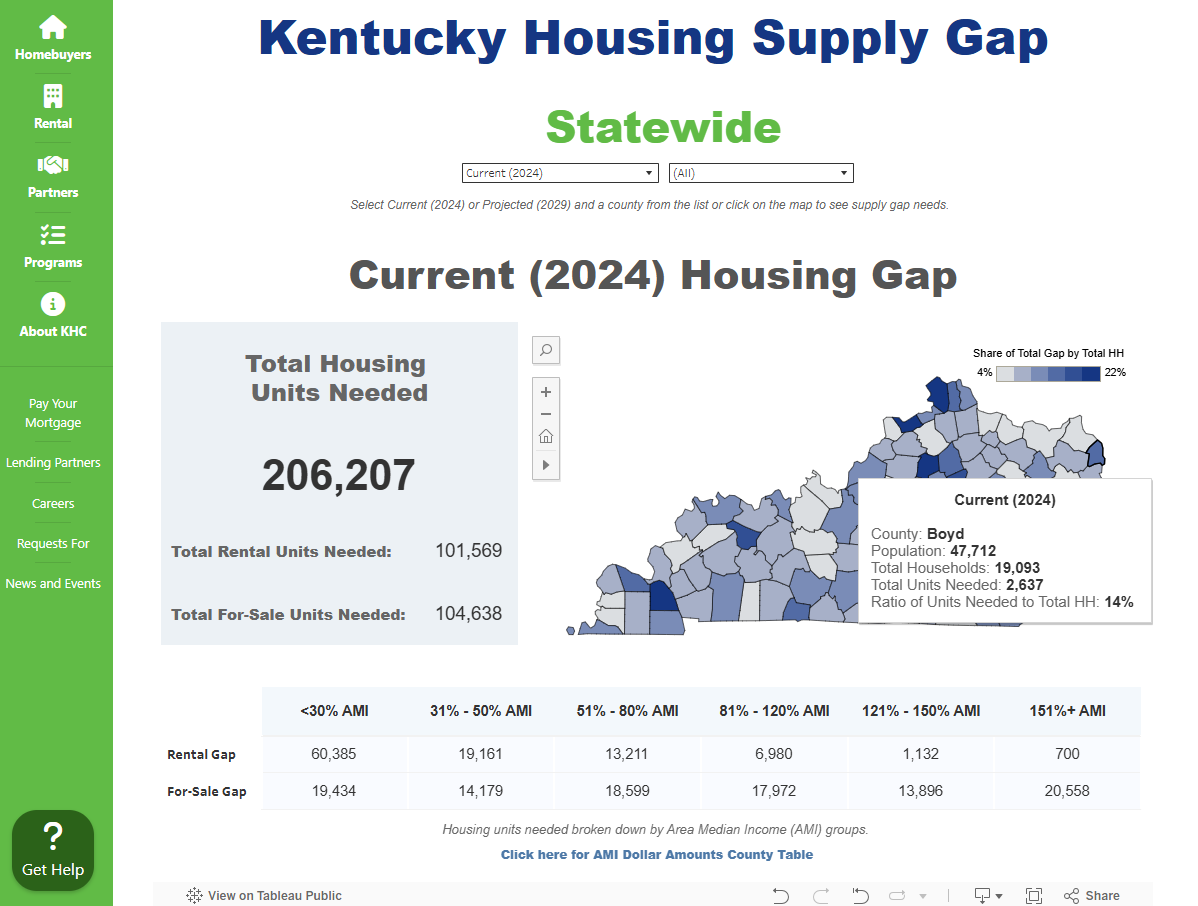
According to the 2024 KHC Housing Gap Analysis:
Kentucky needs 206,207 more housing units to meet current demand. (About half of these are rental units, and half are homes for sale.)
What is the KHC Kentucky Housing Supply Gap Analysis?
KHC, in partnership with Bowen National Research, completed a statewide analysis of the Kentucky Housing Gap including:
- Rental vs. for-sale housing
- County and region (ADDs)
- Income levels using Area Median Income (AMI) categories
- 2024 and 2029 projections
- Severity of housing cost burden
- Vacancy, turnover, substandard housing, and in-commuter data
This data is based on multiple sources, including the U.S. Census, American Community Survey, and Realtor.com listings, and is updated as new data becomes available.
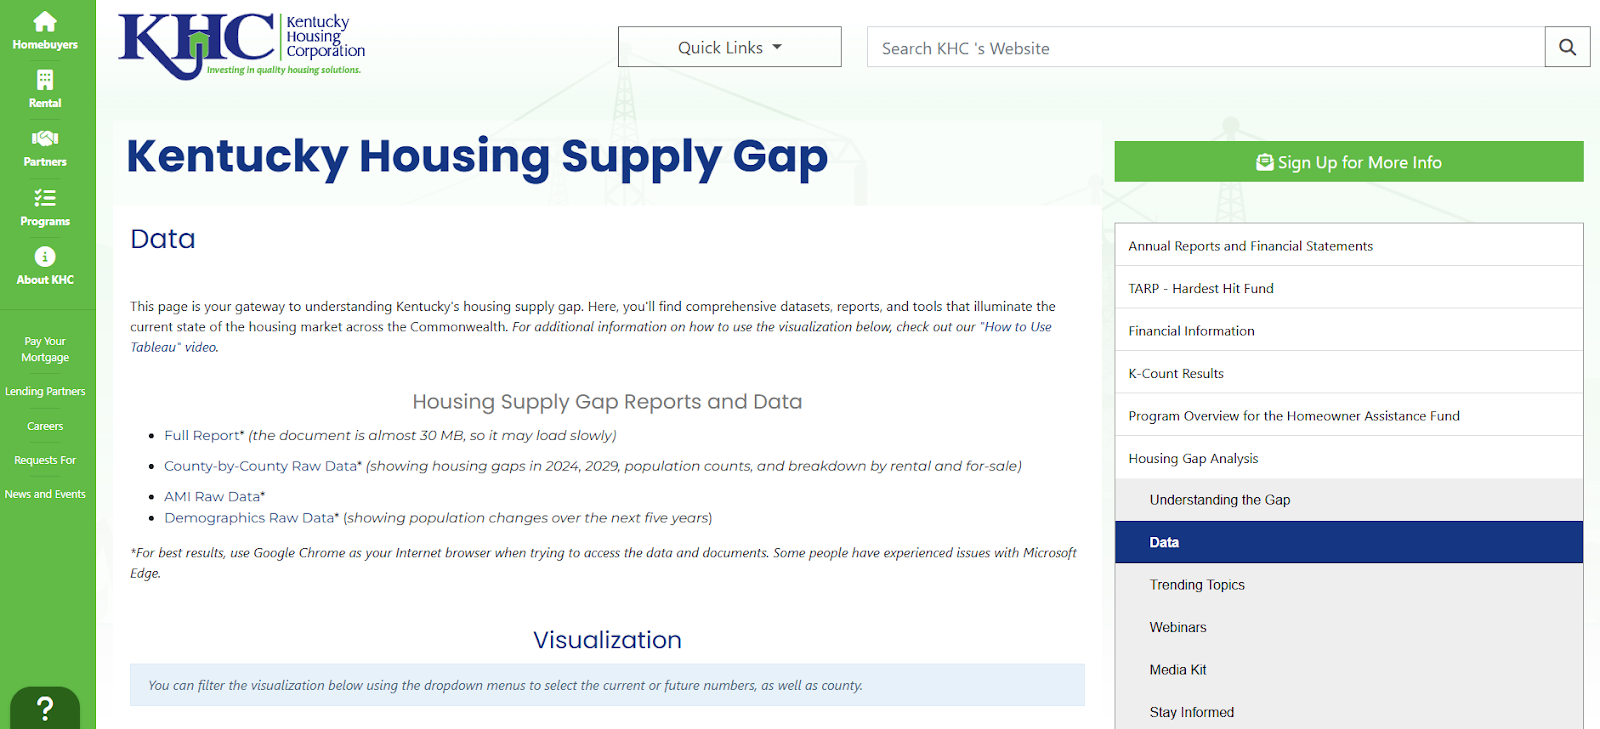
Where to Access the Data Tool
The Housing Supply Gap resources are publicly available online:
- Interactive Dashboard: https://www.kyhousing.org/Data-Library/Housing-Gap-Analysis/Pages/Data.aspx
- Full Report (PDF): View full report
- County-by-County Raw Data: Linked on the same dashboard page
How to Use This Data in a Grant Proposal
Rental Housing Projects
If your organization is applying for funds to support affordable rentals, especially for extremely low-income households, this tool can quantify the need by AMI. For example:
According to the 2024 KHC Housing Gap data, [insert county] has a rental housing gap of [X units], with the largest gap, [Y units], serving households earning below 30 percent of AMI. Our project directly addresses this need by creating [Z units] of affordable rental housing targeted at this group.
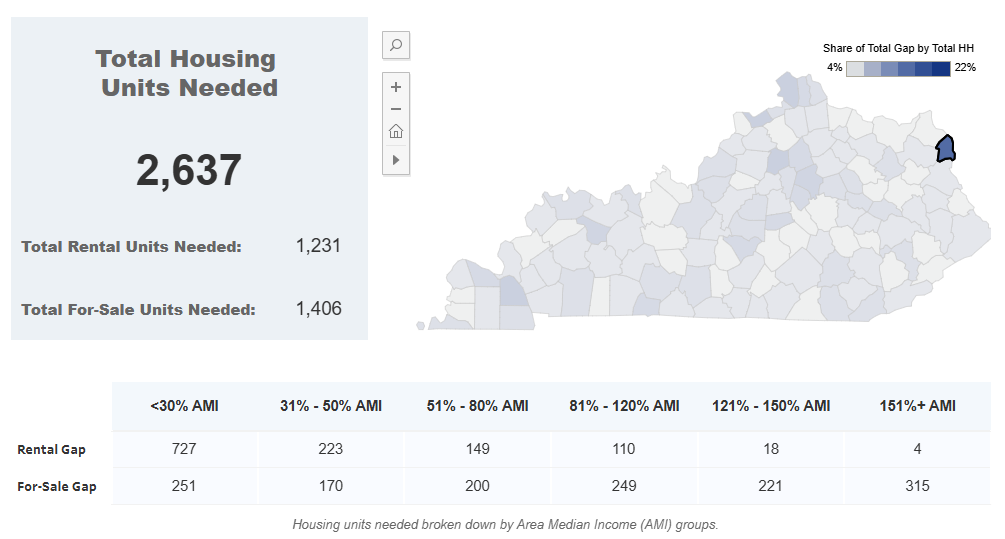
The statewide analysis shows that 91.3 percent of Kentucky’s rental housing gap is among households earning less than or equal to 80 percent of AMI, making this an especially strong focus for funding justification.
Homeownership Projects
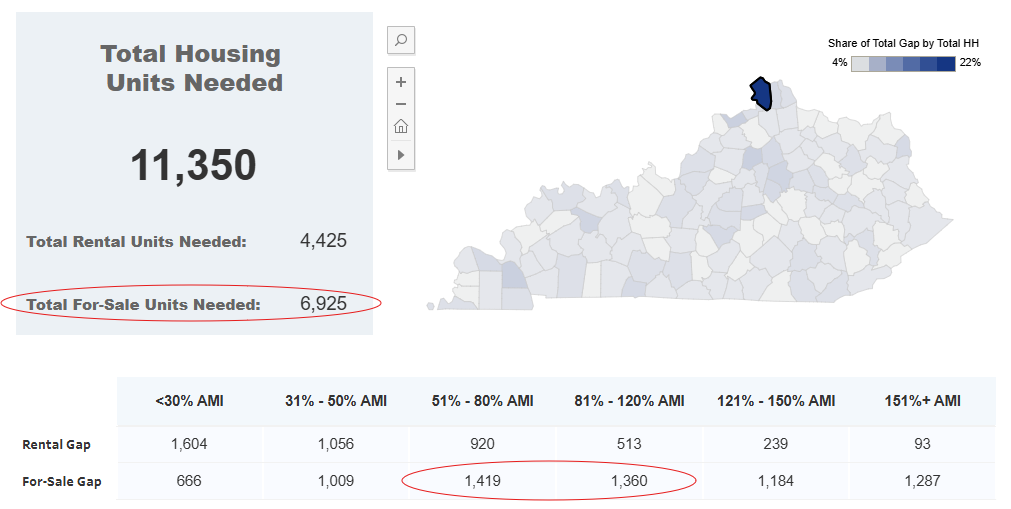
For homeownership development, use the for-sale data to highlight affordability challenges for working families:
The for-sale housing gap in [insert county] is [X units], with a large portion needed for households earning between 51 percent and 120 percent of AMI. This aligns with our project to build starter homes accessible to workforce families.
The data supports the case for rural and suburban projects too. Boone, Marshall, and Franklin counties all show a high ratio of housing gap to household population, particularly for homeownership.
County-by-County and ADD-Level Data
KHC’s County-by-County Data Tables (Download the Raw Data) let you zero in on your community. Each county includes:
- Total housing gap by unit type
- Renter and owner share
- Income-specific housing gaps
- Vacancy and turnover rates
- Substandard housing percentages
- In-commuting workforce counts (valuable for workforce housing proposals)
This data helps you paint a compelling picture of why your county, city, or region urgently needs investment. It can also support multi-county collaboration or Area Development District (ADD)-wide initiatives by comparing gaps across the 15 ADDs used in the study.
Use the Full Report for Narrative Support: Quotes That Bring Data to Life
The full Housing Gap Analysis Report (April 2024) provides clear narrative content you can quote directly in proposals. It explains:
- The drivers behind Kentucky's housing supply crisis
- Why housing for less than 30 percent AMI households is in critical short supply
- The connection between housing and economic development: “Homes are where jobs go to sleep at night” (p. 59)
These quotes and insights help contextualize your project within Kentucky’s broader housing ecosystem.
Bonus Tip: Combine with AMI Tables
Use KHC’s AMI Raw Data and household income tables to align your housing affordability targets with funder requirements. Many grants, especially federal or state housing funds, ask you to define affordability in relation to AMI. KHC’s data lets you cite the right income bands with precision.
Final Thought
Grant professionals know that evidence of need can make or break a proposal. KHC’s Housing Gap Analysis gives you credible, Kentucky-specific data in formats you can easily pull into your narrative, need statements, or logic models.
If you’re building, rehabbing, or advocating for affordable housing, this tool belongs in your grant toolbox.